- Daily Energy Market Update
- Posts
- Daily Energy Market Update May 23,2025

May 30, 2025
WTI is down 71 cents July RB is 2.08 cents July ULSD is down 2.38 centsB….ULSD
Overview
Crude oil has fallen as President Trump tweeted this morning that he will recommend a 50% straight tariff against the European Union starting June 1 as he sees trade discussions between the US & EU going nowhere. Prior to President Trump's tweet, news wires were touting a lower crude price on the week on worries over rising supply from OPEC+. A weaker dollar had curbed some of the overnight losses.
Trump tweeted on Truth Social :" The European Union, which was formed for the primary purpose of taking advantage of the United States on TRADE, has been very difficult to deal with. Our discussions with them are going nowhere! Therefore, I am recommending a straight 50% Tariff on the European Union, starting on June 1, 2025. "
25 of 32 traders and analysts surveyed by Bloomberg see OPEC+ raising output by 411 MBPD in July at their June 1 meeting. Reuters has an article that suggests that OPEC+ is trying to "target U.S. shale" by raising output, in addition to punishing the overproducers in its own group. "Retaking some market share is one motivation for a May 3 decision to bring back output more rapidly than previously planned, according to four of the 10 sources, though none said the strategy constituted a price war yet. To hurt shale producers today, OPEC+ would need to push oil prices lower than their current levels of around $65 per barrel to less than $55-$60, said the sources. Analysts estimate Saudi production costs at $3-$5 per barrel and Russia’s at $10-$20. A source added that having the oil price under $60 per barrel – the G7 price cap imposed on Russian oil due to the Ukraine war – would facilitate exports and might suit Moscow."
The U.S. dollar index has slid back to a near 2 week low at 99.27 today, as concerns grow over mounting U.S. debt with the passing of Trump's budget bill, coming on the heels of Moody's downgrading of U.S. debt. (FXStreet)
The fifth round of talks of U.S.-Iranian nuclear negotiations will take place in Rome on Friday. But, CNN quotes Iranian Sources, who say that Formal Meetings with the U.S. May Not Continue Much Longer. "Supreme Leader Ayatollah Ali Khamenei, who has the last say on Iran's state matters, rejected Washington's demands that Tehran stop refining uranium as "excessive and outrageous", warning that the talks are unlikely to yield results." (Reuters)
Bloomberg data and fixture reports indicate observed crude oil shipments into Europe from the US Gulf are set to rise to 1.76 MMBPD in May, the most in three months.
India’s imports of Russian oil are at a 10-mointh high in May close to 1.8 MMBPD according to Kpler figures - supported by higher ESPO crude grade buying.
Thursday saw "HCOB's preliminary composite eurozone Purchasing Managers' Index drop to 49.5 this month from 50.4 in April, and the bloc's dominant services industry suffered a deeper downturn in demand in a clear sign of the impact of U.S. tariffs on the eurozone economy." (Reuters)
Notable in LO/ WTI options is the large increase in open interest in the July $71 calls. About 8,000 contracts traded between 20 and 23 cents.
Technicals
Technicals
Technically the price pattern of the past 10 days has a mostly sideways look for the crude oil and RB. Distillates have more of a downward channel pattern during that time. RB momentum on the July daily chart has turned neutral. Momentum for the crude oil and distillates remains negative.
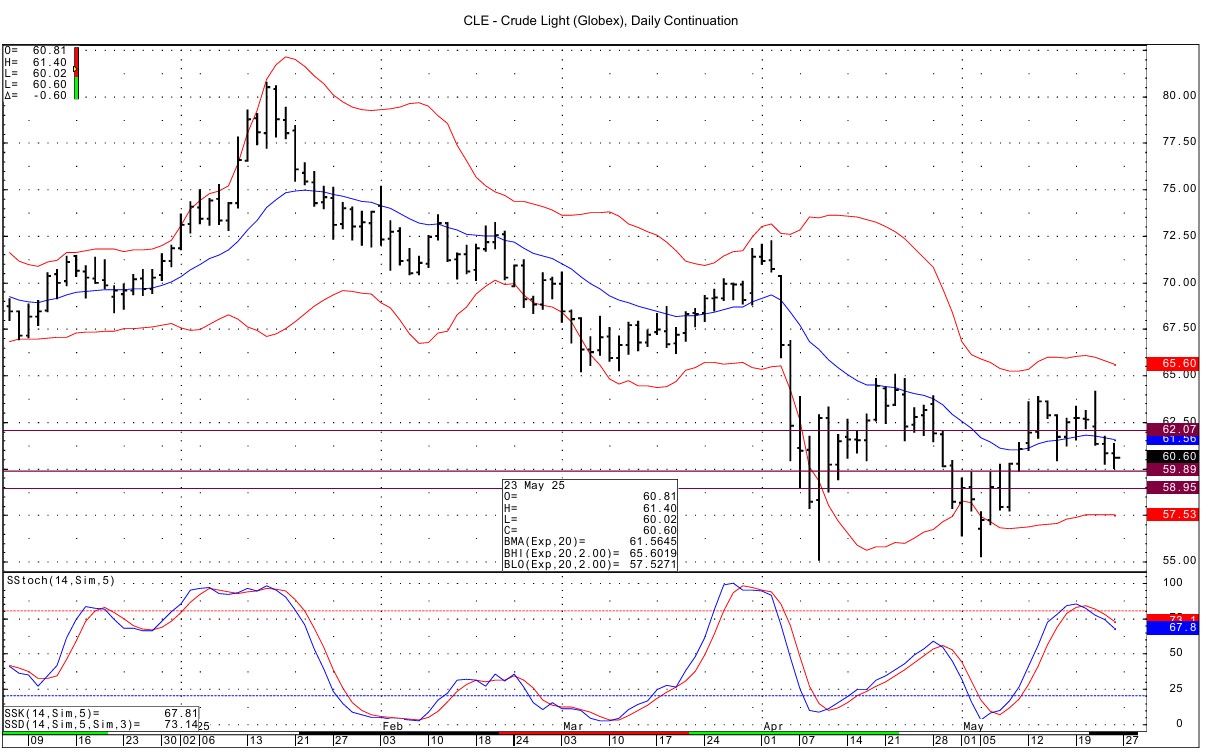
WTI spot futures have support at 59.84-59.89 and then at 58.95. Resistance lies at 62.06-62.07.
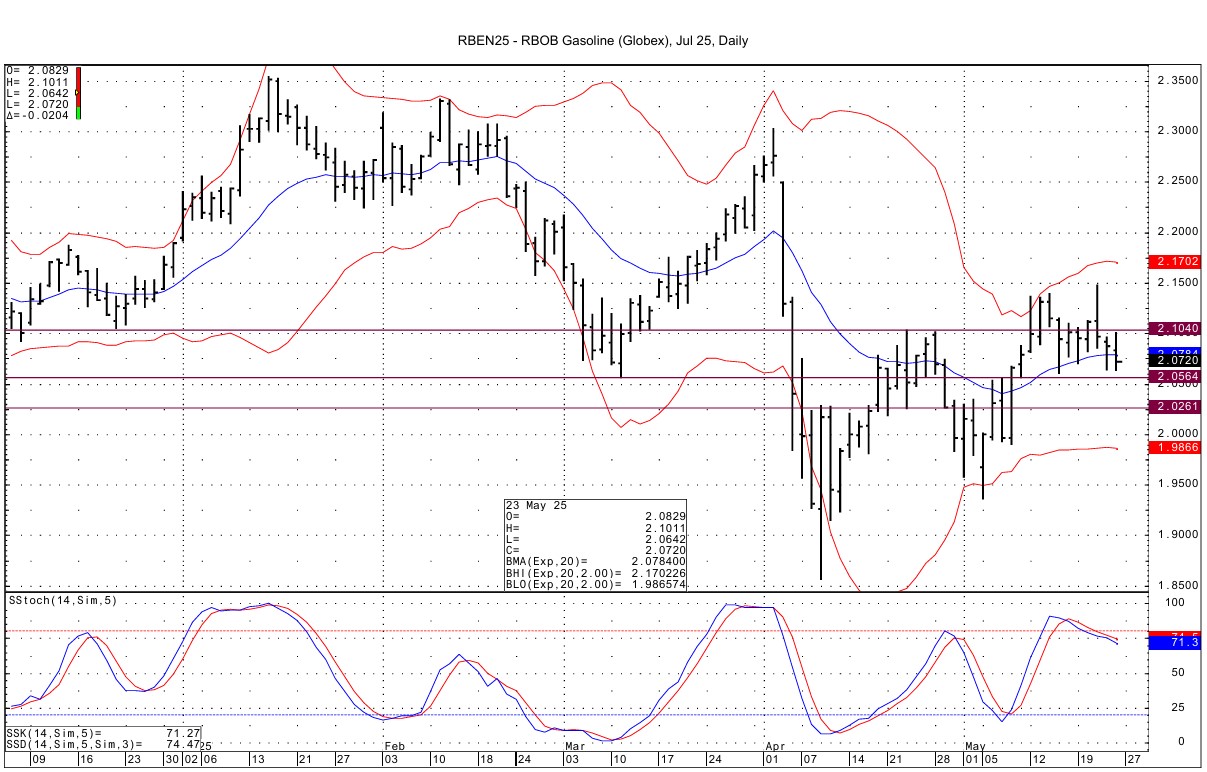
July RB support lies at 2.0564-2.0571. There is currently a double bottom from yesterday/today at 2.0644-2.0642. Further support lies below at 2.0255-2.0261. Resistance comes in at 2.1020-2.1040.
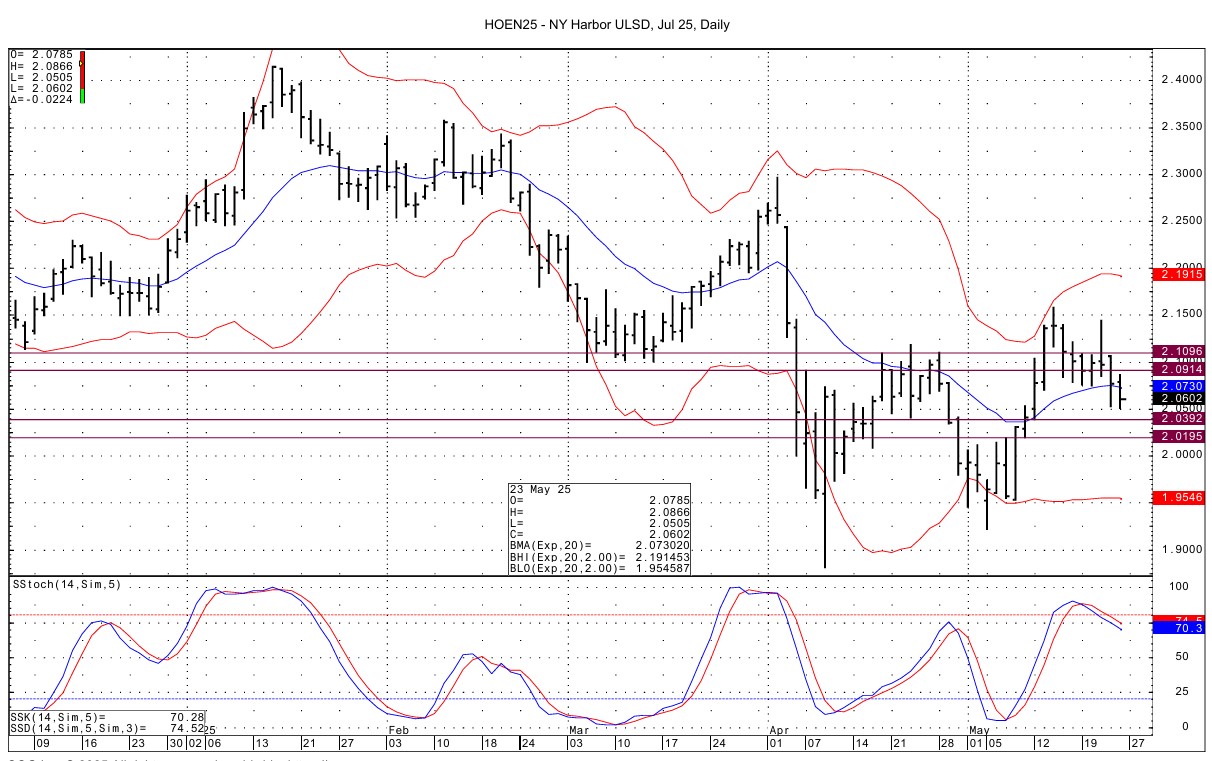
July ULSD sees support at 2.0392-2.0405 and then at 2.0188-2.0195. Resistance lies at 2.0914-2.0915 and then at 2.1083-2.1096.
Natural Gas - NG is
Natural Gas --NG is down 2.7 cents
NG futures are a little lower, as the tone seems to be a negative one due to the large injection seen Thursday in the EIA data and "still soft seasonal demand, amid reduced air-conditioning needs across key population centers in the Midwest and East". (WSJ source)
The EIA gas storage data disappointed with a build of 120 BCF, which was 4-5 BCF more than the Reuters/WSJ surveys. This was the 4th straight injection of more than 100 BCF and was the largest of the season. This is the first such stretch of 100+ injections since September/October of 2022. (Celsius Energy) Total storage rose to 2.375 TCF. This is +90 BCF / +3.94% over the 5 year average, but -333 BCF / -12.30% versus last year's level.
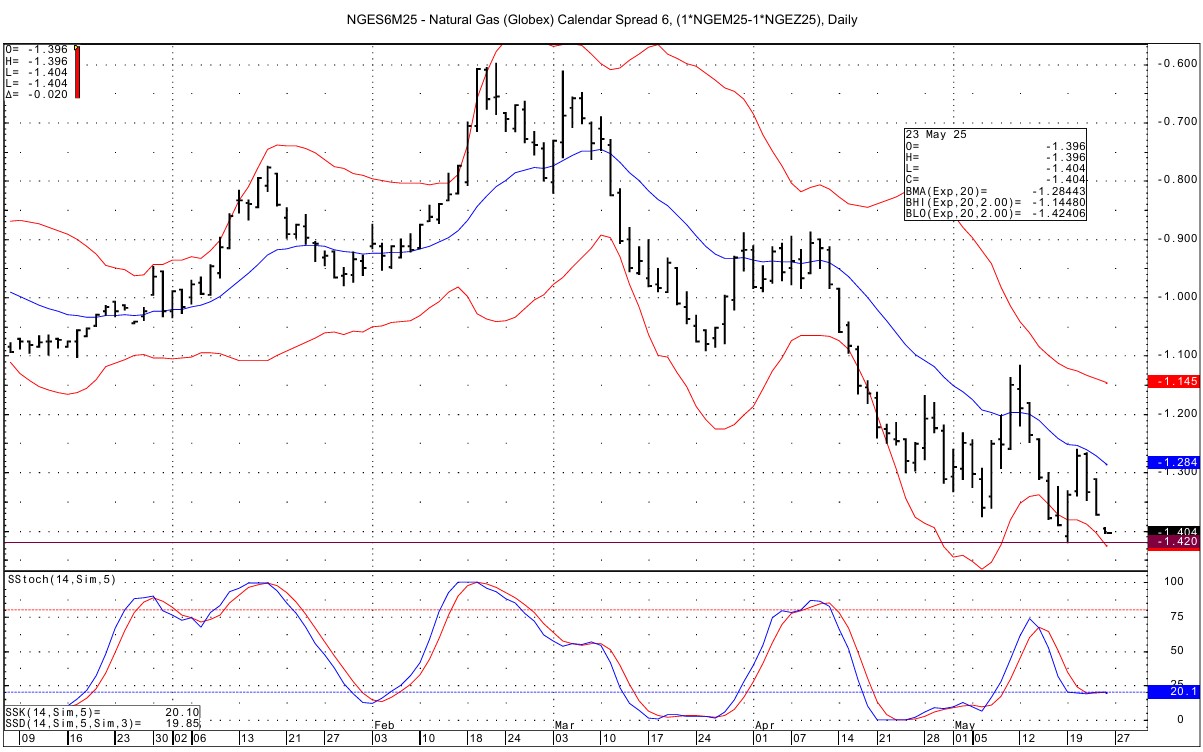
The forward curve in NG futures suffered Thursday due to the storage data and that has continued today, with the June/December spread falling to near the recent low. That low is -$1.42 with the last print seen today being -$1.404.
Nat-gas prices were also under pressure Thursday from forecasts for cooler than normal spring temperatures in the U.S. WSI Trader said Thursday that forecasts shifted cooler for a large portion of the eastern and central US for May 27-31. (Barchart.com)
Bloomberg data is showing feed gas demand running at 14.3 BCF/d today, which is below the 30 day average of 14.9 BCF/d. Production has ticked up as per Bloomberg data with yesterday's level being 107.1 BCF/d , compared to the 30 day average of 106.2 BCF/d.
Two notable trades were seen in the LN/NG options on the CME in Thursday's activity, with both showing a negative bias for the forward curve. The June July spread one month minus 40 cent put traded 2.0 and 2.3 cents. The underlying futures spread settled minus 38.6 cents Thursday. The spread has fallen to its lowest value today. The August/September plus 15 cent call/ minus 5 cent put fence traded with the put buyer collecting 0.1 cent.
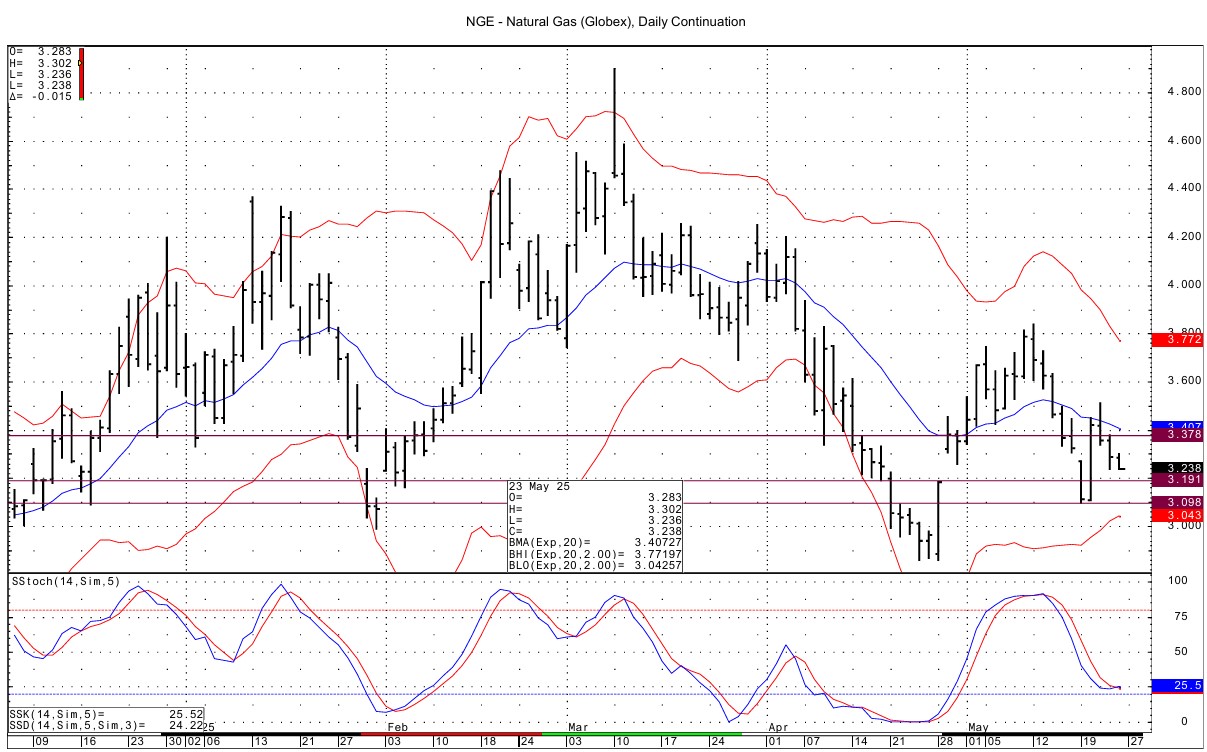
Technically the spot NG futures have seen momentum trying to turn positive basis the DC chart as we head to the last week of trading for the June futures. Support lies at 3.189-3.195 and then at the double bottom from this week at 3.098-3.107. Resistance is seen at 3.375-3.381. images here for Nat Gas (and enter gain/loss in the blue bar above)
Enjoyed this article?
Subscribe to never miss an issue. Daily updates provide a comprehensive analysis of both the fundamentals and technical factors driving energy markets.
Click below to view our other newsletters on our website:
Disclaimer
This article and its contents are provided for informational purposes only and are not intended as an offer or solicitation for the purchase or sale of any commodity, futures contract, option contract, or other transaction. Although any statements of fact have been obtained from and are based on sources that the Firm believes to be reliable, we do not guarantee their accuracy, and any such information may be incomplete or condensed.
Commodity trading involves risks, and you should fully understand those risks prior to trading. Liquidity Energy LLC and its affiliates assume no liability for the use of any information contained herein. Neither the information nor any opinion expressed shall be construed as an offer to buy or sell any futures or options on futures contracts. Information contained herein was obtained from sources believed to be reliable, but is not guaranteed as to its accuracy. Any opinions expressed herein are subject to change without notice, are that of the individual, and not necessarily the opinion of Liquidity Energy LLC
Reply